
The graph below shows the population of a particular country by age group starting in 1960 and including a forecast to 2040.
Summarize the information by selecting and reporting the main features, and make comparisons where relevant.
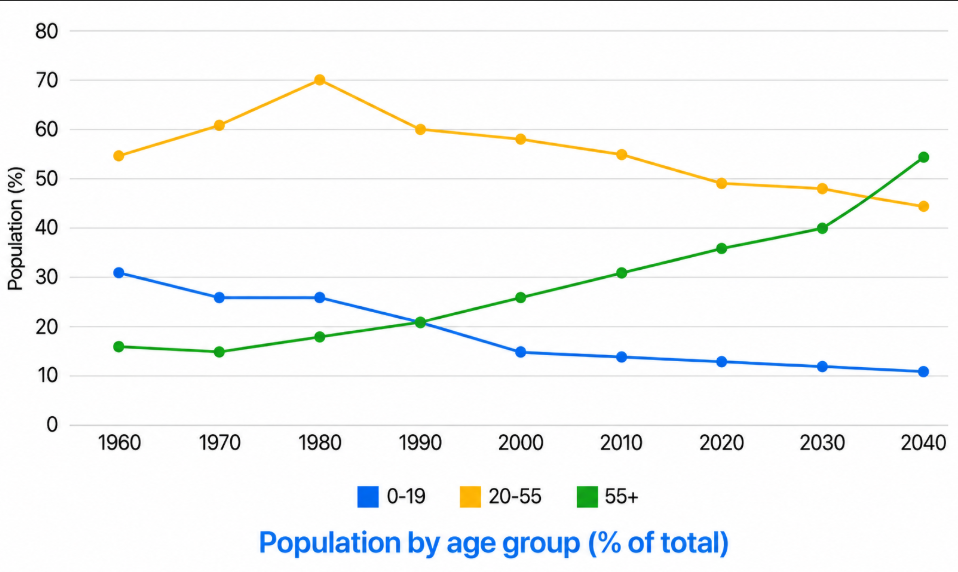
The line graph compares the proportions of a country’s population across three age groups (0–19, 20–55 and 55+) from 1960 to 2020, with projections up to 2040.
Overall, both the 0–19 and 20–55 age groups show a downward trend over the period, whereas the proportion of people aged 55 and above increases steadily and is expected to become the largest group by 2040.
Looking first at the younger and working-age populations, the percentage of people aged 20–55 rose from 55% in 1960 to a peak of 70% in 1980. However, this figure then declined gradually, reaching 50% in 2020 and is forecast to fall further to 45% by 2040. A similar but more consistent decrease can be observed in the 0–19 group, whose share dropped continuously from 30% in 1960 to 12% in 2020, before being projected to decline slightly further to around 10% at the end of the period.
In contrast, the population aged 55+ experienced a continuous increase. Starting at just 17% in 1960, this figure rose steadily to 38% by 2020 and is expected to climb sharply to 55% by 2040, overtaking the other two age groups.
Useful vocabulary:
- projections (n.): estimates or predictions about future figures based on current data
- downward trend (n. phrase): a general pattern of decrease over a period of time
- consistent (adj.): happening in the same way continuously, without sudden changes
- climb sharply (v. phrase): to increase quickly and by a large amount
- overtake (v.): to become larger, higher, or more important than something else
Introduction and Overview
Introduction
Paraphrase the title of the line graph
State that the graph shows changes in population proportions by age group over time, including future projections
Overview
General trends:
Both the 0–19 and 20–55 age groups show an overall downward trend throughout the period.
In contrast, the proportion of people aged 55 and over increases steadily.
The 55+ age group is expected to become the largest segment of the population by 2040.
Body 1
Paragraph 1 (0–19 and 20–55 age groups)
20–55 age group:
Increased from 55% in 1960 to a peak of 70% in 1980
Declined gradually thereafter, reaching 50% in 2020
Projected to fall further to 45% by 2040
0–19 age group:
Showed a continuous and consistent decline
Dropped from 30% in 1960 to 12% in 2020
Forecast to decrease slightly further to around 10% by 2040
Comparison:
Both groups follow a similar downward trend, although the decline in the 0–19 group is more consistent
Body 2
Paragraph 2 (55+ age group)
Started as the smallest group at 17% in 1960
Increased steadily over the entire period, reaching 38% in 2020
Expected to rise sharply to 55% by 2040
Comparison:
The 55+ group overtakes the other two age groups to become the dominant population segment
Bài viết đáp ứng đầy đủ yêu cầu của đề bài, mô tả và so sánh các xu hướng dân số qua các nhóm tuổi từ năm 1960 đến dự báo năm 2040. Các số liệu chính được chọn lọc và phân tích rõ ràng, thể hiện được sự thay đổi lớn trong tỷ lệ các nhóm tuổi.
Cấu trúc bài rõ ràng, các đoạn văn được liên kết chặt chẽ với nhau, các câu nối hợp lý giúp người đọc dễ theo dõi các ý tưởng. Tuy nhiên, có thể tăng cường thêm các từ nối để nâng cao tính liên kết mạch lạc.
✔️ Sử dụng từ vựng khá chính xác và đa dạng như 'forecast', 'gradually', 'proportion'. ✔️ Từ ngữ phù hợp với chủ đề biểu đồ dân số. ❌ 'compare' → ✅ 'compares' (điều chỉnh thì động từ) ❌ 'go down' → ✅ 'decrease' ✔️ Biết dùng các thuật ngữ mô tả xu hướng (increase, decrease, rise, fall). Band 7: vốn từ tốt, một số lỗi nhỏ.
✔️ Sử dụng các cấu trúc câu đơn và phức hợp tương đối đa dạng. ✔️ Kiểm soát được thì quá khứ, hiện tại và tương lai (dự báo). ❌ 'The line graph compare' → ✅ 'The line graph compares' ❌ 'the share of people aged 55 and over increase strongly' → ✅ 'increases strongly' ❌ Câu 'It is expected to reach only about 45%' hơi thiếu chủ ngữ rõ ràng. ✔️ Có một vài lỗi nhỏ liên quan đến chia động từ và cấu trúc câu. Band 6.5 do lỗi sai nhỏ thường xuyên.
- Chỉnh sửa chính tả và ngữ pháp cho đúng, đặc biệt là chia động từ phù hợp.
- Tăng cường sử dụng từ nối và cụm từ kết nối để bài viết mạch lạc hơn.
- Mở rộng vốn từ bằng cách thay thế các từ thân thuộc bằng từ đồng nghĩa trang trọng hơn.
- Thêm chi tiết hoặc so sánh cụ thể hơn giữa các nhóm tuổi vào các đoạn để tăng tính phân tích.
Đề 1 Writing
The graph below shows the population of a particular country by age group starting in 1960 and including a forecast to 2040.
Summarize the information by selecting and reporting the main features, and make comparisons where relevant.
The line graph compares the proportions of a country’s population across three age groups (0–19, 20–55 and 55+) from 1960 to 2020, with projections up to 2040.
Overall, both the 0–19 and 20–55 age groups show a downward trend over the period, whereas the proportion of people aged 55 and above increases steadily and is expected to become the largest group by 2040.
Looking first at the younger and working-age populations, the percentage of people aged 20–55 rose from 55% in 1960 to a peak of 70% in 1980. However, this figure then declined gradually, reaching 50% in 2020 and is forecast to fall further to 45% by 2040. A similar but more consistent decrease can be observed in the 0–19 group, whose share dropped continuously from 30% in 1960 to 12% in 2020, before being projected to decline slightly further to around 10% at the end of the period.
In contrast, the population aged 55+ experienced a continuous increase. Starting at just 17% in 1960, this figure rose steadily to 38% by 2020 and is expected to climb sharply to 55% by 2040, overtaking the other two age groups.
Useful vocabulary:
- projections (n.): estimates or predictions about future figures based on current data
- downward trend (n. phrase): a general pattern of decrease over a period of time
- consistent (adj.): happening in the same way continuously, without sudden changes
- climb sharply (v. phrase): to increase quickly and by a large amount
- overtake (v.): to become larger, higher, or more important than something else
Introduction and Overview
Introduction
Paraphrase the title of the line graph
State that the graph shows changes in population proportions by age group over time, including future projections
Overview
General trends:
Both the 0–19 and 20–55 age groups show an overall downward trend throughout the period.
In contrast, the proportion of people aged 55 and over increases steadily.
The 55+ age group is expected to become the largest segment of the population by 2040.
Body 1
Paragraph 1 (0–19 and 20–55 age groups)
20–55 age group:
Increased from 55% in 1960 to a peak of 70% in 1980
Declined gradually thereafter, reaching 50% in 2020
Projected to fall further to 45% by 2040
0–19 age group:
Showed a continuous and consistent decline
Dropped from 30% in 1960 to 12% in 2020
Forecast to decrease slightly further to around 10% by 2040
Comparison:
Both groups follow a similar downward trend, although the decline in the 0–19 group is more consistent
Body 2
Paragraph 2 (55+ age group)
Started as the smallest group at 17% in 1960
Increased steadily over the entire period, reaching 38% in 2020
Expected to rise sharply to 55% by 2040
Comparison:
The 55+ group overtakes the other two age groups to become the dominant population segment
Bài viết đáp ứng đầy đủ yêu cầu của đề bài, mô tả và so sánh các xu hướng dân số qua các nhóm tuổi từ năm 1960 đến dự báo năm 2040. Các số liệu chính được chọn lọc và phân tích rõ ràng, thể hiện được sự thay đổi lớn trong tỷ lệ các nhóm tuổi.
Cấu trúc bài rõ ràng, các đoạn văn được liên kết chặt chẽ với nhau, các câu nối hợp lý giúp người đọc dễ theo dõi các ý tưởng. Tuy nhiên, có thể tăng cường thêm các từ nối để nâng cao tính liên kết mạch lạc.
✔️ Sử dụng từ vựng khá chính xác và đa dạng như 'forecast', 'gradually', 'proportion'. ✔️ Từ ngữ phù hợp với chủ đề biểu đồ dân số. ❌ 'compare' → ✅ 'compares' (điều chỉnh thì động từ) ❌ 'go down' → ✅ 'decrease' ✔️ Biết dùng các thuật ngữ mô tả xu hướng (increase, decrease, rise, fall). Band 7: vốn từ tốt, một số lỗi nhỏ.
✔️ Sử dụng các cấu trúc câu đơn và phức hợp tương đối đa dạng. ✔️ Kiểm soát được thì quá khứ, hiện tại và tương lai (dự báo). ❌ 'The line graph compare' → ✅ 'The line graph compares' ❌ 'the share of people aged 55 and over increase strongly' → ✅ 'increases strongly' ❌ Câu 'It is expected to reach only about 45%' hơi thiếu chủ ngữ rõ ràng. ✔️ Có một vài lỗi nhỏ liên quan đến chia động từ và cấu trúc câu. Band 6.5 do lỗi sai nhỏ thường xuyên.
- Chỉnh sửa chính tả và ngữ pháp cho đúng, đặc biệt là chia động từ phù hợp.
- Tăng cường sử dụng từ nối và cụm từ kết nối để bài viết mạch lạc hơn.
- Mở rộng vốn từ bằng cách thay thế các từ thân thuộc bằng từ đồng nghĩa trang trọng hơn.
- Thêm chi tiết hoặc so sánh cụ thể hơn giữa các nhóm tuổi vào các đoạn để tăng tính phân tích.
Write about the following topic:
Traditionally, senior leadership roles within organizations have been dominated by older individuals, while others believe that younger leaders may perform better. To what extent do you agree or disagree with this view?
Give reasons for your answer and include any relevant examples from your own knowledge or experience.
Leadership positions within organizations have traditionally been occupied by older individuals, largely due to the belief that age equates to wisdom and sound judgment. While this view has some merit, I largely agree that younger leaders can be more effective in many contemporary organizational settings.
Admittedly, older leaders often possess a wealth of experience that enables them to navigate complex situations with confidence. Having encountered a wide range of professional challenges, they are typically better at assessing risks and making cautious, well-reasoned decisions. Moreover, emotional maturity, which tends to develop over time, allows senior leaders to remain composed during crises and manage conflicts in a measured manner. These qualities make older leadership particularly valuable in stable industries or high-stakes environments.
Nevertheless, younger leaders are often better equipped to respond to the demands of today’s fast-paced and innovation-driven world. Growing up in the digital age, they are generally more adaptable to technological change and more willing to experiment with new ideas. In addition, younger leaders frequently adopt collaborative management styles, prioritizing teamwork, open communication, and employee empowerment. This approach not only enhances productivity but also fosters a culture of creativity and engagement. The success of many global start-ups and technology firms, led by young executives, illustrates how youthful leadership can drive organizational growth and competitiveness.
In conclusion, while the experience and stability offered by older leaders should not be dismissed, younger leaders possess qualities that align more closely with the needs of modern organizations. Encouraging leadership structures that combine innovation with experience would ultimately yield the most effective outcomes.
Useful Vocabulary:
- equate to (v. phrase): to be considered as the same as something else
- contemporary (adj.): belonging to the present time; modern
- well-reasoned decisions (n. phrase): decisions made after careful and logical consideration
- remain composed (v. phrase): to stay calm and in control, especially in difficult situations
- high-stakes environment (n. phrase): a situation where important outcomes depend on decisions
- innovation-driven world (n. phrase): a world shaped by continuous technological and creative development
- digital age (n. phrase): the modern era characterized by widespread use of digital technology
Introduction
Leadership in organizations has traditionally been associated with age and experience.
While older leaders bring valuable experience, I largely agree that younger leaders can be more effective in many modern organizational contexts.
Body 1
Older leaders often possess a wealth of experience
Older people are better at assessing risks and making cautious.
Older people are emotionally mature.
Body 2
Younger leaders are often better equipped to respond to the demands of today’s fast-paced world.
Young people are more adaptable to technological change.
Younger leaders frequently adopt collaborative management styles.
Conclusion
Although experience remains valuable, younger leaders are increasingly better positioned to lead modern organizations.
A balanced leadership approach that integrates youthful innovation with seasoned experience should be encouraged.
Bài viết trả lời đầy đủ câu hỏi, trình bày ý kiến cá nhân rõ ràng và phát triển các luận điểm theo yêu cầu. Có sự cân nhắc giữa ưu và nhược điểm của cả lãnh đạo trẻ và già, đồng thời có kết luận rõ ràng.
Bố cục bài logic, các đoạn văn được liên kết tốt qua các câu nối như 'however', 'on the other hand', 'in conclusion'. Các ý được trình bày theo thứ tự hợp lí giúp người đọc dễ hiểu.
✔️ Từ vựng phong phú, phù hợp với chủ đề lãnh đạo và kinh doanh như 'risk', 'crisis', 'innovative', 'responsibility'. ✔️ Biết cách sử dụng các cụm từ đa dạng trong cách diễn đạt. ❌ 'decide leadership ability' → ✅ 'decides leadership ability' ❌ 'adapt quickly with changes' → ✅ 'adapt quickly to changes' ✔️ Giới thiệu từ vựng chuyên ngành và thuật ngữ mang tính học thuật. Band 7: từ vựng tốt, một số lỗi nhỏ.
✔️ Sử dụng thành thạo nhiều cấu trúc câu phức và câu đơn. ✔️ Kiểm soát ngữ pháp tốt, các thì động từ được vận dụng chuẩn xác. ❌ 'age is not the only factor which decide' → ✅ 'decides' ❌ 'adapt quickly with changes' → ✅ 'adapt quickly to changes' ✔️ Ít lỗi ngữ pháp và câu trúc biến đổi đa dạng. Band 7 với một số lỗi nhỏ.
- Chú ý sửa các lỗi ngữ pháp nhỏ liên quan đến chia động từ và giới từ.
- Phát triển thêm ví dụ cụ thể để làm rõ lập luận.
- Giúp bài viết thêm phần sinh động bằng cách sử dụng các câu nối đa dạng hơn.
- Cân nhắc thêm quan điểm cá nhân chi tiết hơn để tăng tính thuyết phục.